GuidesDashboard Overview
Dashboard Overview
A tour of the NemoRouter dashboard — what each part of the sidebar does
Last updated
The Overview page is your dashboard home. It's the first thing you see after signing in, and it summarizes the health of your organization at a glance.
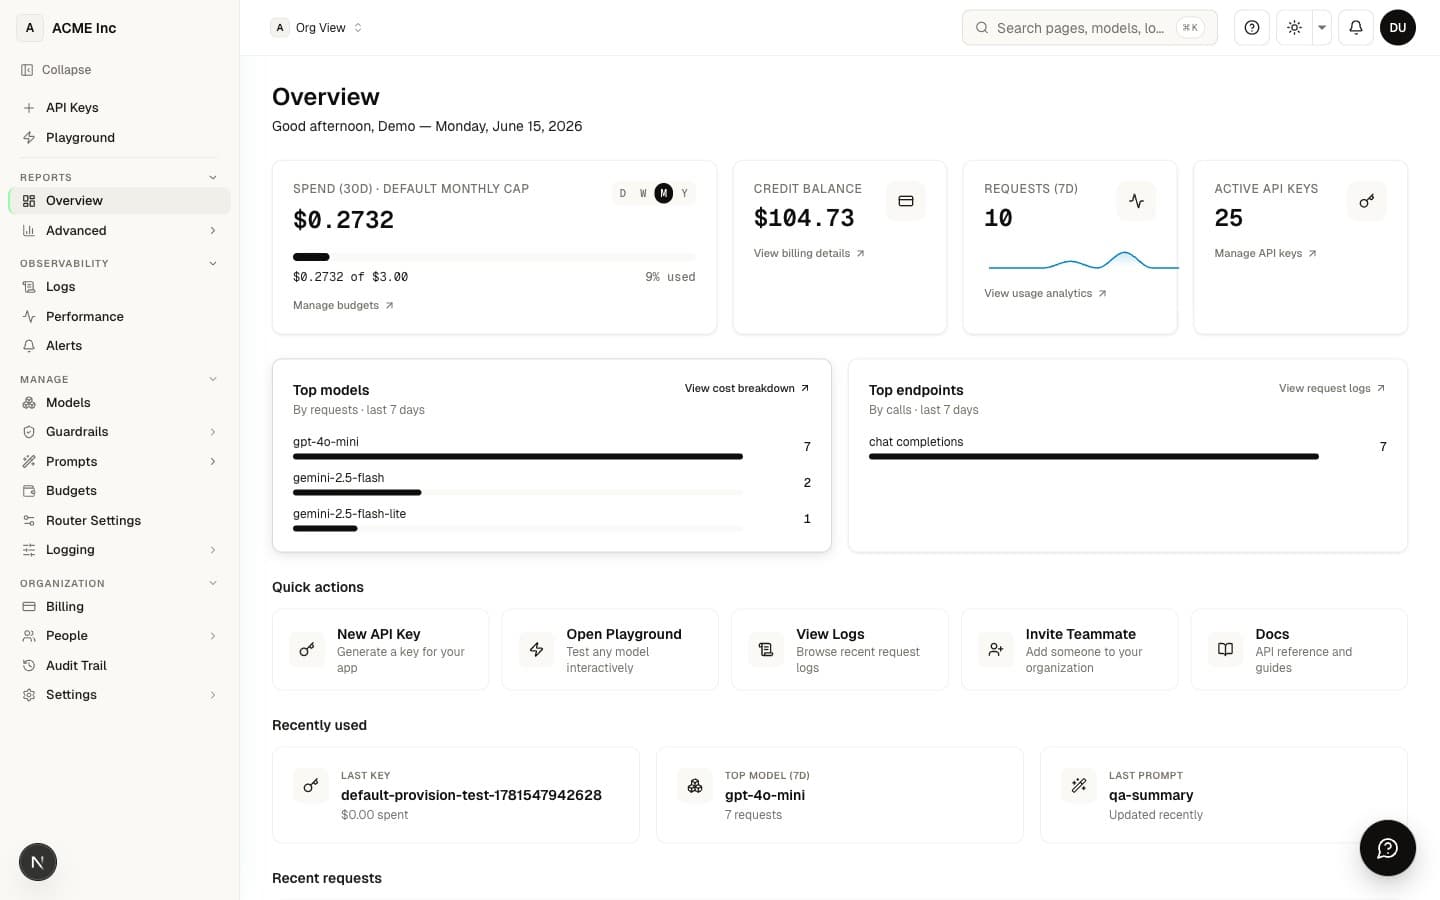
What's on the Overview
- Credit balance — your available credits right now
- Active keys — how many virtual API keys are live
- Prompt templates — your saved prompts count
- Budget card — utilization for the current cycle
- Top breakdowns — your busiest models and endpoints
- Setup guidance — onboarding hints while your org is new
Finding your way around
The left sidebar groups every feature. Here's the map, with links to the guide for each:
| Sidebar item | What it's for | Guide |
|---|---|---|
| API Keys | Create and manage virtual keys | API Key Management |
| Playground | Test models interactively | Playground |
| Overview | This page | — |
| Advanced | Cost, usage, budgets, benchmarks | Analytics & Reports |
| Logs | Per-request observability | Observability & Logs |
| Performance | Latency and reliability | Analytics & Reports |
| Alerts | Error, latency, and budget alerts | Alerts & Notifications |
| Models | The model catalog | Model Catalog |
| Guardrails | Content safety and PII | Guardrails |
| Prompts | Prompt templates and A/B tests | Prompt Management |
| Budgets | Set spend caps | Budget Controls |
| Router Settings | Routing strategy and fallbacks | Router Settings |
| Logging | Callbacks, alert channels, data policy | Observability & Logs |
| Billing | Credits, plans, invoices | Billing & Credits |
| People | Members and teams | Team Management |
| Audit Trail | Who changed what | Audit Log |
| Settings | Org configuration | Organization Settings |
Sections with a secondary panel
A few areas open a secondary panel — a second column of sub-pages — when you enter them:
- Advanced → Explore, Cost, Usage, Cost vs Usage, Compare, Benchmark, Budgets, Key Usage, Agents, API Consumers
- Guardrails → Org Guardrails, Key Assignments, Execution Logs
- Prompts → Templates, Recommendations, Prompt → Keys, Prompt → Teams, A/B Tests, History, Execution Logs
- Logging → Data Policy, Callbacks, Alert Channels
- People → Members, Teams
- Settings → General, Security, Privacy, Branding, Localization, Danger Zone
What you can see depends on your role
Some items appear only for owners and admins — Router Settings, Logging, Audit Trail, and Settings. The People section is hidden for solo (individual) accounts. Members and viewers see most pages in read-only mode.
Next steps
- Quick Start — Make your first API call
- API Key Management — Create the key your code uses
- Analytics & Reports — Track cost and usage
Was this page helpful?