

Analytics & Reports
Track cost, usage, latency, and budgets with NemoRouter's Advanced reports
Last updated
NemoRouter's Advanced section turns your request history into spend, usage, and performance reports. Every report shares a common filter bar — pick a time window, group by a dimension (model, provider, key, team, or tag), and narrow further with "More filters". For per-end-user attribution, use the API Consumers report.
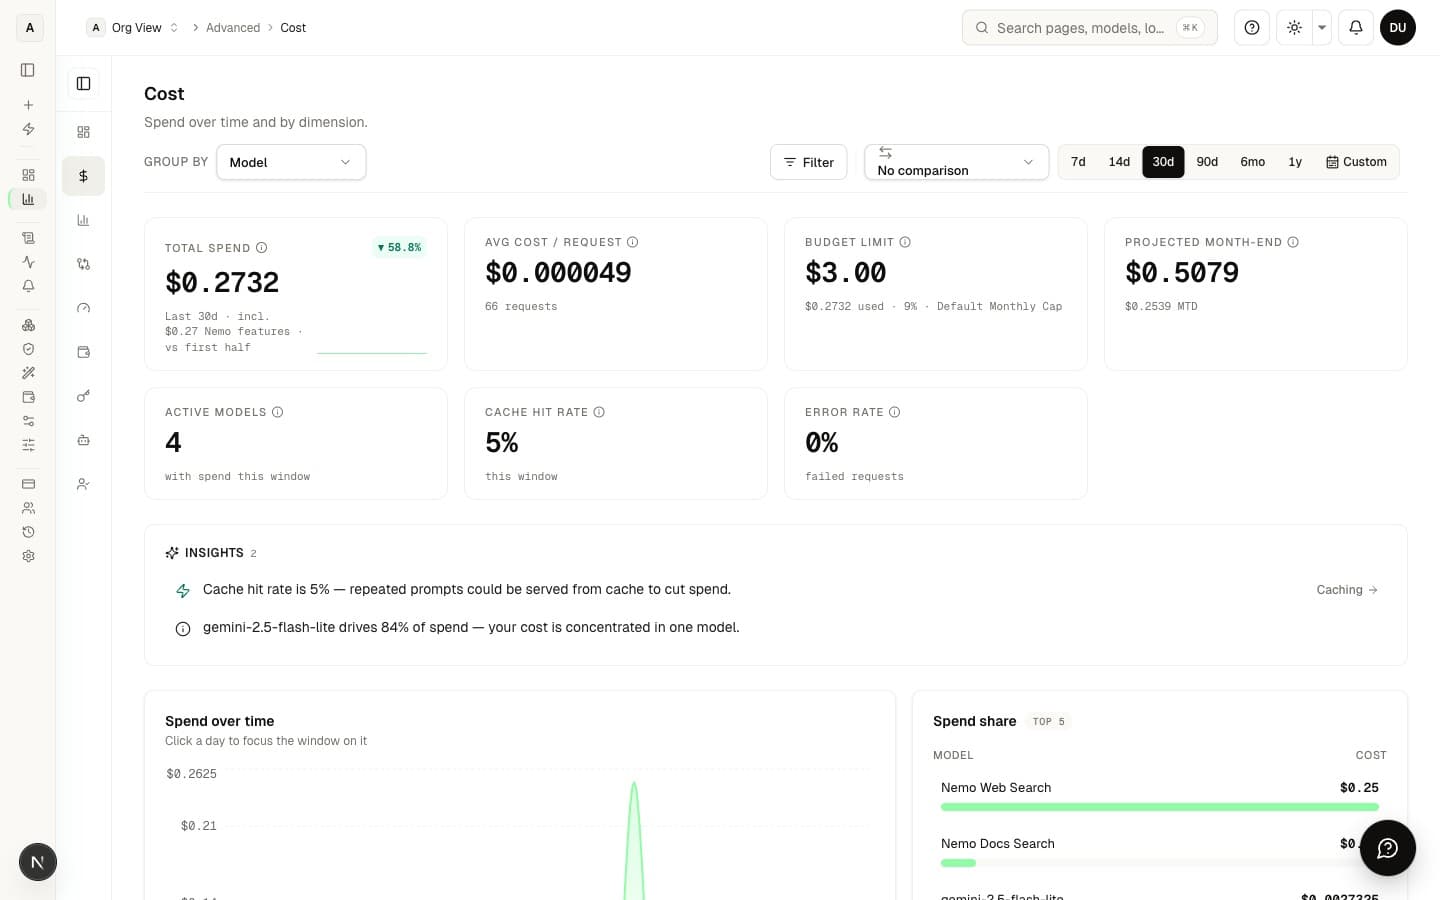
The reports at a glance
| Report | Path | Answers |
|---|---|---|
| Explore | /advanced/explore | One screen combining cost, usage, and budget — the best starting point |
| Cost | /advanced/cost | Where is my money going? Spend by model/key/tag over time |
| Usage | /advanced/usage | How much traffic? Requests and tokens (prompt/completion split) |
| Cost vs Usage | /advanced/cost-vs-usage | Efficiency — cost per request and per 1k tokens |
| Budgets | /advanced/budgets | Burn-down against your caps; what's at risk |
| Key Usage | /advanced/keys | Per-key spend, tokens, cache hit rate, and latency |
| Agents | /advanced/agents | Spend by agent tag |
| API Consumers | /advanced/api-consumers | Spend by end-user |
| Compare | /advanced/compare | This period vs the last (or vs last year) |
| Benchmark | /advanced/benchmark | Model-by-model cost, latency, throughput, reliability |
Shared controls
- Time window — presets from 24h up to 1 year (24h, 7d, 14d, 30d, 90d, 6mo, 1y) or a custom range.
- Group by — pivot every chart and table by model, provider, key, team, or tag.
- More filters — narrow to a specific value of the grouped dimension.
- CSV export — available on Cost, Usage, Cost vs Usage, Explore, Agents, API Consumers, and Performance (admin/owner only).
Cost
The Cost report leads with total spend, a period-over-period trend, and a sparkline. Below that:
- A daily spend line chart, optionally overlaid with your daily-budget allowance.
- A top-5 share bar list for the grouped dimension (click a bar to filter).
- A full breakdown table — searchable, sortable, and exportable to CSV.
Alongside spend it surfaces requests, tokens (prompt/completion), cost per request, cache hit rate, error rate, average latency, and how your current budget cycle is tracking. Charges from Nemo tools (agents/MCP) are broken out separately so they don't distort your LLM spend.
Usage
Usage is the request-and-token twin of Cost. It shows total requests and total tokens (with the prompt/completion percentage split), average tokens per request, average latency, and error rate — all over your selected window, grouped by your chosen dimension.
Cost vs Usage
This report focuses on efficiency: cost per request and cost per 1,000 tokens, plotted as cost-versus-requests and cost-versus-tokens scatter charts. Nemo tool charges are intentionally excluded here so the unit-cost ratios stay accurate (tool charges are flat per call, not token-scaled).
Budgets
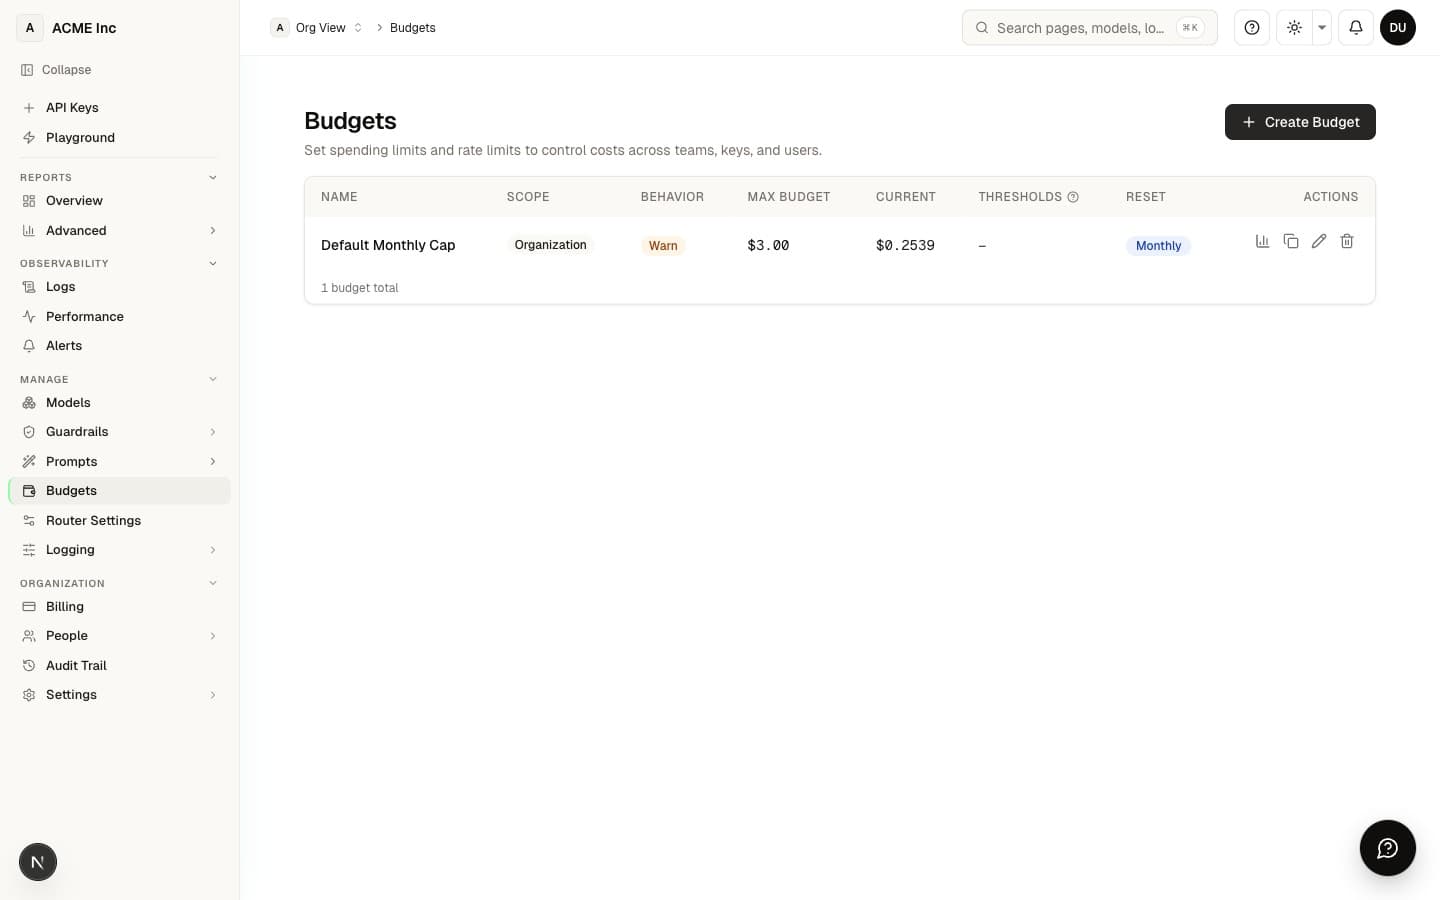
The Budgets report shows how your spend is tracking against every budget you've set, at org, team, key, and user scope. Because those scopes overlap, the headline metric is peak utilization (the single most-burned budget) rather than a sum that would double-count dollars. Budgets at or above 80% are flagged amber; over 100% is red.
Budget enforcement uses the credit ledger (authoritative), while the spend chart comes from observability logs — small differences between the two are expected. Manage the budgets themselves under Budget Controls.
Key Usage
A per-key rollup: spend, requests, input/output tokens, cache hit rate, average and p95 latency, and last-active time for every virtual key. Expand a row to see that key's per-model breakdown. The token/cache/latency figures are sampled from recent logs for high-volume orgs.
Agents & API Consumers
- Agents attributes cost and requests to agent tags. Tag your requests with
agent:<id>to populate it. - API Consumers attributes all-time spend to end-users (the
userfield on your requests).
Both are sensitive dimensions — they require elevated permission to view.
Compare
Compare overlays your current window against a baseline — the previous period (default), the same period last year, or a custom range. KPIs show the current value plus the percentage delta, and the insights call out which models or keys moved the most.
Benchmark
A side-by-side table of every model you've used: requests, tokens, spend, cost per 1k tokens, cost per request, average and p95 latency, throughput (tokens/sec), error rate, and cache hit rate. The headline picks out the cheapest, fastest, most reliable, and highest-throughput model. Click a row to jump to Cost filtered to that model.
For very long windows (6 months or 1 year), latency columns are capped at a 90-day lookback while spend and tokens use the full window — a note appears when this applies.
Performance
The dedicated Performance page (/performance) goes deeper on latency and reliability: request rate, error rate, and cache hit rate KPIs; the full latency percentile suite (p50, p75, p90, p95, p99, plus min/max/avg/stddev); latency over time; a per-model or per-key latency breakdown; success-vs-error trends; and a request heatmap by day-of-week and hour. Latency analytics are computed across your full window; the per-request sample is capped at the most recent 1,000 logs.
Next steps
- Budget Controls — Set the caps these reports track against
- Observability & Logs — Drill from a report into individual requests
- API Key Management — Tag and scope keys so reports stay meaningful
FAQ
Who on my team can view these reports and export the data?
Any member with dashboard access can open the Advanced reports and Performance page. Members and viewers see performance scoped to their own API keys — request rate, latency percentiles, error rate, and cache-hit rate all reflect only the traffic from keys they own; owners and admins see the whole organization (or their own view via the My View / Org toggle). CSV export (on Cost, Usage, Cost vs Usage, Explore, and Performance) is restricted to admin and owner roles, and the Agents and API Consumers reports are sensitive dimensions that also require elevated permission to view.
Does viewing analytics cost me credits or count against my rate limits?
No. Every report is read-only reporting built from your existing request history — opening a chart, changing the time window, or exporting a CSV never consumes credits and never counts toward your RPM/TPM limits.
Why doesn't the spend in Analytics exactly match my budget enforcement or invoice?
Budget enforcement uses the credit ledger, which is authoritative, while the spend charts are drawn from observability logs — so small differences between the two are expected. Trust the ledger and your Budget Controls for hard limits; treat the charts as the analytical view.
How do I break my spend down by model, key, team, or tag?
Use the shared Group by control to pivot every chart and table by model, provider, key, team, or tag, then use More filters to narrow to a specific value. On the Cost report you can also click a bar in the top-5 share list to filter to that dimension instantly. To attribute spend to individual end-users, use the API Consumers report instead.
Can I attribute cost to specific agents or individual end-users?
Yes. The Agents report attributes cost to agent tags — tag your requests with agent:<id> to populate it — and API Consumers attributes all-time spend to end-users via the user field on your requests. Both are sensitive dimensions that require elevated permission to view.
How far back can I look, and are there any limits on long time windows?
You can pick presets from 24h up to 1 year (24h, 7d, 14d, 30d, 90d, 6mo, 1y) or a custom range. On very long windows (6 months or 1 year), Benchmark caps latency columns to a 90-day lookback while spend and tokens use the full window (a note appears when this applies), and the Performance page computes latency across your full window but caps the per-request sample at the most recent 1,000 logs.
Are Nemo tool and agent (MCP) charges mixed into my LLM spend numbers?
No — they're kept separate so they don't distort your model spend. The Cost report breaks tool charges out on their own, and Cost vs Usage excludes them entirely so the per-request and per-1k-token unit costs stay accurate (tool charges are flat per call, not token-scaled).
How do I tell which model is cheapest, fastest, or most reliable for my traffic?
The Benchmark report gives a side-by-side table of every model you've used — spend, cost per 1k tokens, cost per request, average and p95 latency, throughput, error rate, and cache hit rate — and the headline calls out the cheapest, fastest, most reliable, and highest-throughput model. Click a row to jump to Cost filtered to that model.
Can I compare this period against the previous one or last year?
Yes. The Compare report overlays your current window against a baseline — the previous period (default), the same period last year, or a custom range — showing each KPI's current value plus a percentage delta, with insights on which models or keys moved the most.
Where do I set the budgets these reports track against, or drill into a single request?
Set and manage the caps under Budget Controls — the Budgets report only visualizes burn-down against them, flagging budgets at 80% amber and over 100% red. To go from a report down to individual requests, use Observability & Logs.