A model that serves 5% of your requests can be 60% of your bill. If you only watch request volume, that model is invisible — small bar, no attention — while it quietly dominates spend. Cost-vs-usage analytics exist to surface exactly this divergence: the place where "how often" and "how much" disagree, which is almost always where the savings are.
Why do cost and usage diverge?
Because per-request cost varies by orders of magnitude across models and prompt shapes. A request is a request when you count them; in dollars, they're nothing alike.
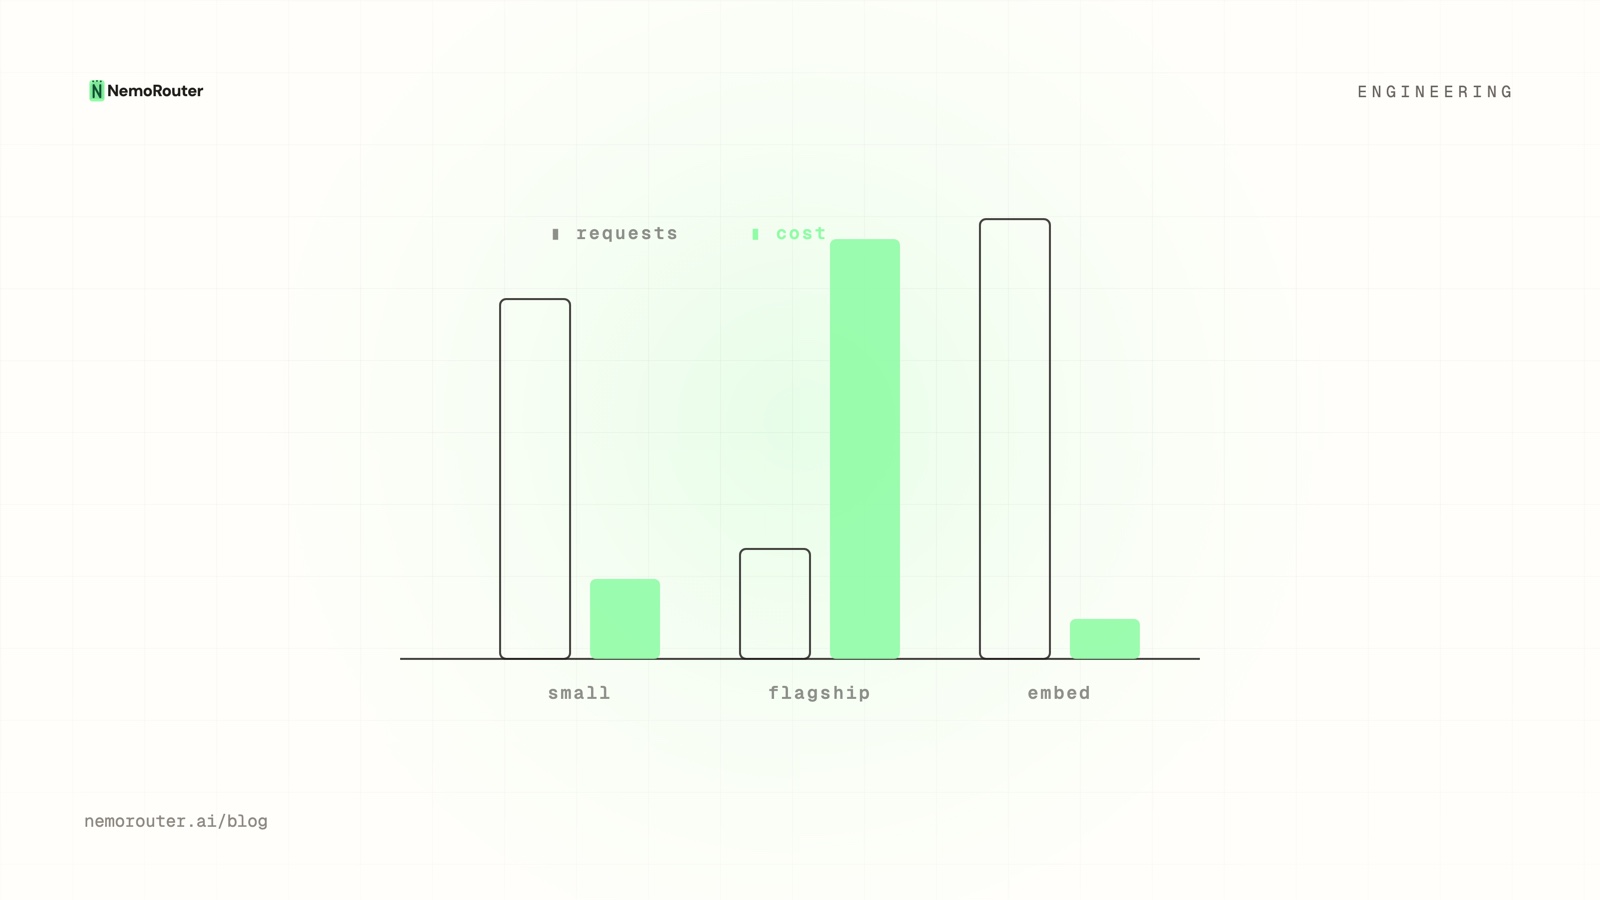
            requests        cost
small model   78%           14%      ← high volume, low cost
flagship      12%           71%      ← low volume, dominates the bill
embeddings    10%            5%
Plotting usage and cost on the same timeline immediately shows the flagship line towering over its modest request share. That gap is the actionable signal: a small slice of traffic you might be able to route, cache, or down-size for a large slice of the bill.
The four shapes worth recognizing
When you overlay cost and usage, the patterns repeat:
| Pattern | Cost vs usage | What it means | Move |
|---|---|---|---|
| The whale | Cost ≫ usage | A pricey model on a minority of calls | Can it be a cheaper model? Route by need. |
| The bargain | Usage ≫ cost | Cheap model doing real work | Safe to send more here |
| The leak | Cost rising, usage flat | Per-call cost crept up | Pricing change? Prompt bloat? Lost cache? |
| The spike | Both jump together | Genuine traffic increase | Capacity/budget question, not efficiency |
The first two are routing opportunities; the third is an investigation; the fourth is a planning input. Same chart, four different decisions.
"Cost rising, usage flat" is the one to chase
Of the four, the leak is the most valuable to catch early because it's pure waste — you're paying more for the same work. Common causes, in order of likelihood:
- Prompt bloat — context grew (more history, bigger RAG chunks) so input tokens — and cost — crept up without more requests.
- Lost caching — a cache that used to hit now misses (a templating change, a cache-busting field), so you re-pay for repeated input.
- A pricing change — the provider raised a rate; because the gateway reports the authoritative cost of each call, this shows up immediately and correctly rather than hiding behind a stale price table.
- A model swap — a default quietly moved to a pricier model.
Because the cost number is the provider's settled value, the chart never lies to you about whether cost rose — only your investigation decides why.
Attribution makes this precise
Overlay cost-vs-usage with tags and the whale gets a name: it's the summarizer feature on the enterprise tier, not just "the flagship." A breakdown you can act on beats an aggregate you can only worry about.
From insight to routing
The payoff of spotting a whale or a bargain is a routing decision. If a flagship is dominating cost on a task a smaller model handles well, route that task down. If a cheap model is quietly doing great work, you can lean on it harder. This is where analytics meets A/B testing: measure cost-vs-usage, hypothesize a cheaper route, and test it deterministically before committing — then watch the next period's chart confirm the savings.
The takeaway
Counting requests tells you what's busy; counting dollars tells you what's expensive; only overlaying them tells you where they disagree — and the disagreement is the opportunity. Learn the four shapes (whale, bargain, leak, spike), chase "cost up, usage flat" first because it's pure waste, and turn each finding into a routing move. Your Cost vs Usage report is where the quietly expensive model finally becomes visible.