If you monitor LLM latency with a single average number, you are measuring the experience nobody has. Averages smear the slow requests into the fast ones; the user staring at a spinner is in the tail, and the tail is exactly what the mean hides. This post is how to measure LLM latency honestly — with percentiles — and what p50, p95, and p99 actually tell you.
Why does the average lie?
Latency distributions are right-skewed: most requests are quick, a few are very slow, and there's no symmetric "below average" to balance the slow ones. Consider ten requests (ms):
180, 190, 200, 210, 220, 230, 250, 300, 900, 2400
mean = 508 ms ← no single request was anywhere near this
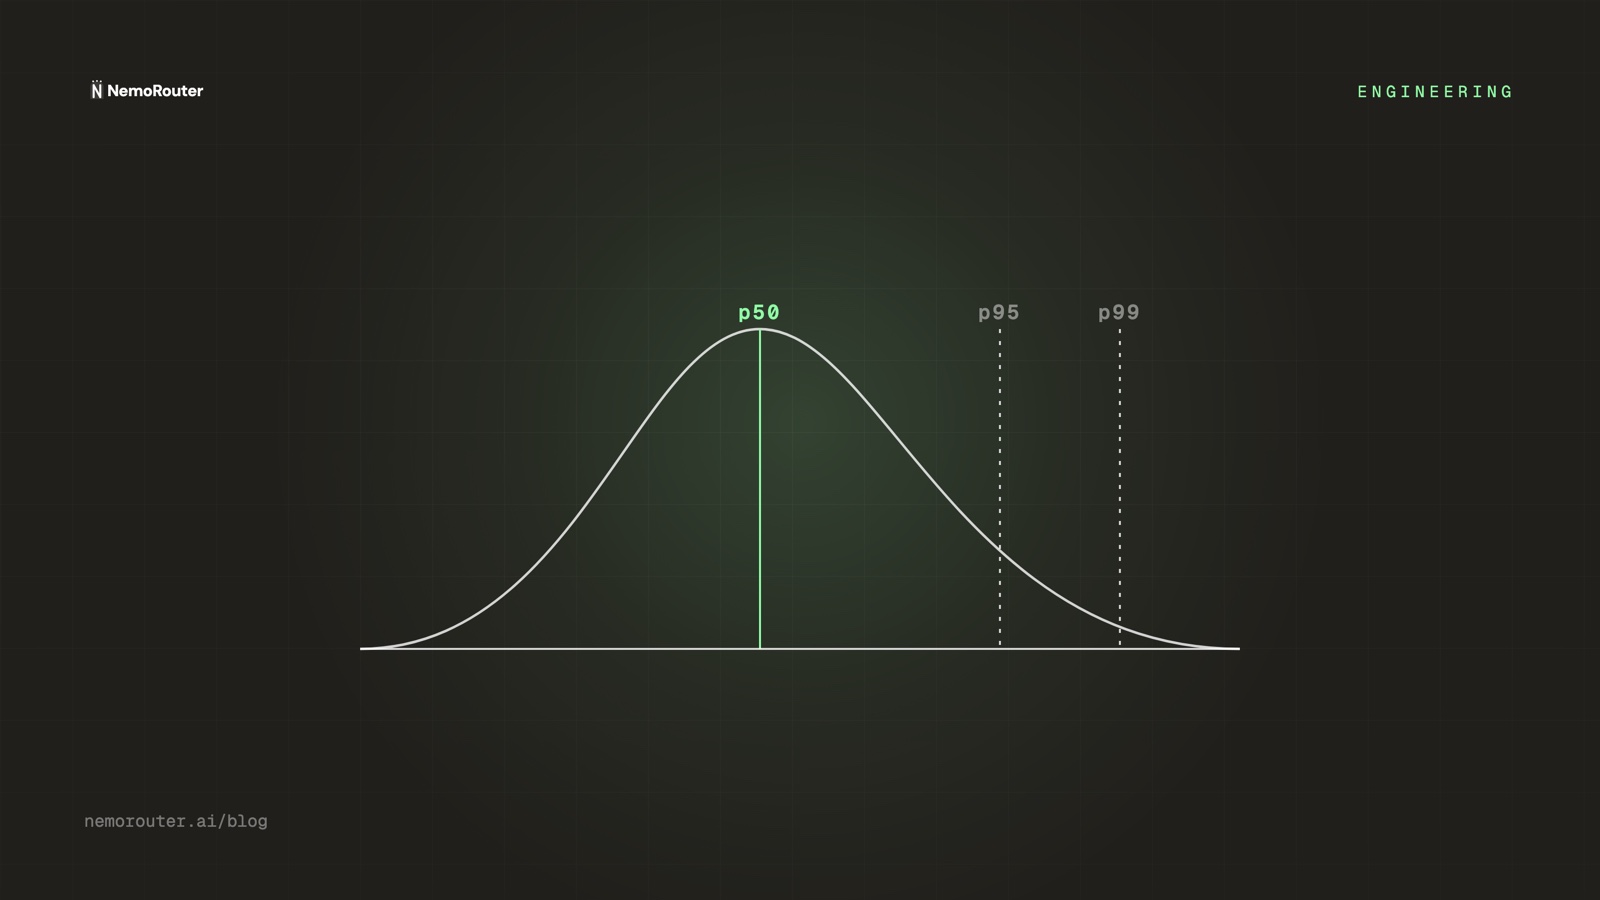
p50 = 225 ms ← the typical request
p95 = ~2400 ms ← the request that made someone leaveThe mean (508 ms) describes none of these requests. The median (p50, 225 ms) describes the typical one. And the p95/p99 describe the ones that decide whether users trust your product. You design for the tail, not the mean.
What each percentile tells you
| Percentile | Reads as | Use it to |
|---|---|---|
| p50 (median) | "typical request" | Track the common-case experience |
| p95 | "1 in 20 is at least this slow" | Set SLOs; catch creeping regressions |
| p99 | "1 in 100 worst case" | Find tail causes: cold starts, big prompts, retries |
A healthy system has a tight gap between p50 and p99. A widening gap means something is occasionally going very wrong — a provider hiccup, a fallback firing, an oversized context — even while the median looks fine.
LLM-specific: time-to-first-token vs total
LLMs have a latency dimension web services don't: streaming. There are two numbers, and they answer different questions:
- Time-to-first-token (TTFT) — how long until the user sees anything. This is the perceived-responsiveness number; it's what the spinner measures.
- Total completion time — how long until the response is done. This scales with output length and matters for batch and agent steps.
A model can have great TTFT and slow total (streams quickly but generates a long answer), or poor TTFT and fast total. Measure both, and percentile both. Optimizing the average of "total time" while ignoring TTFT is how you ship something that feels slow but benchmarks fine.
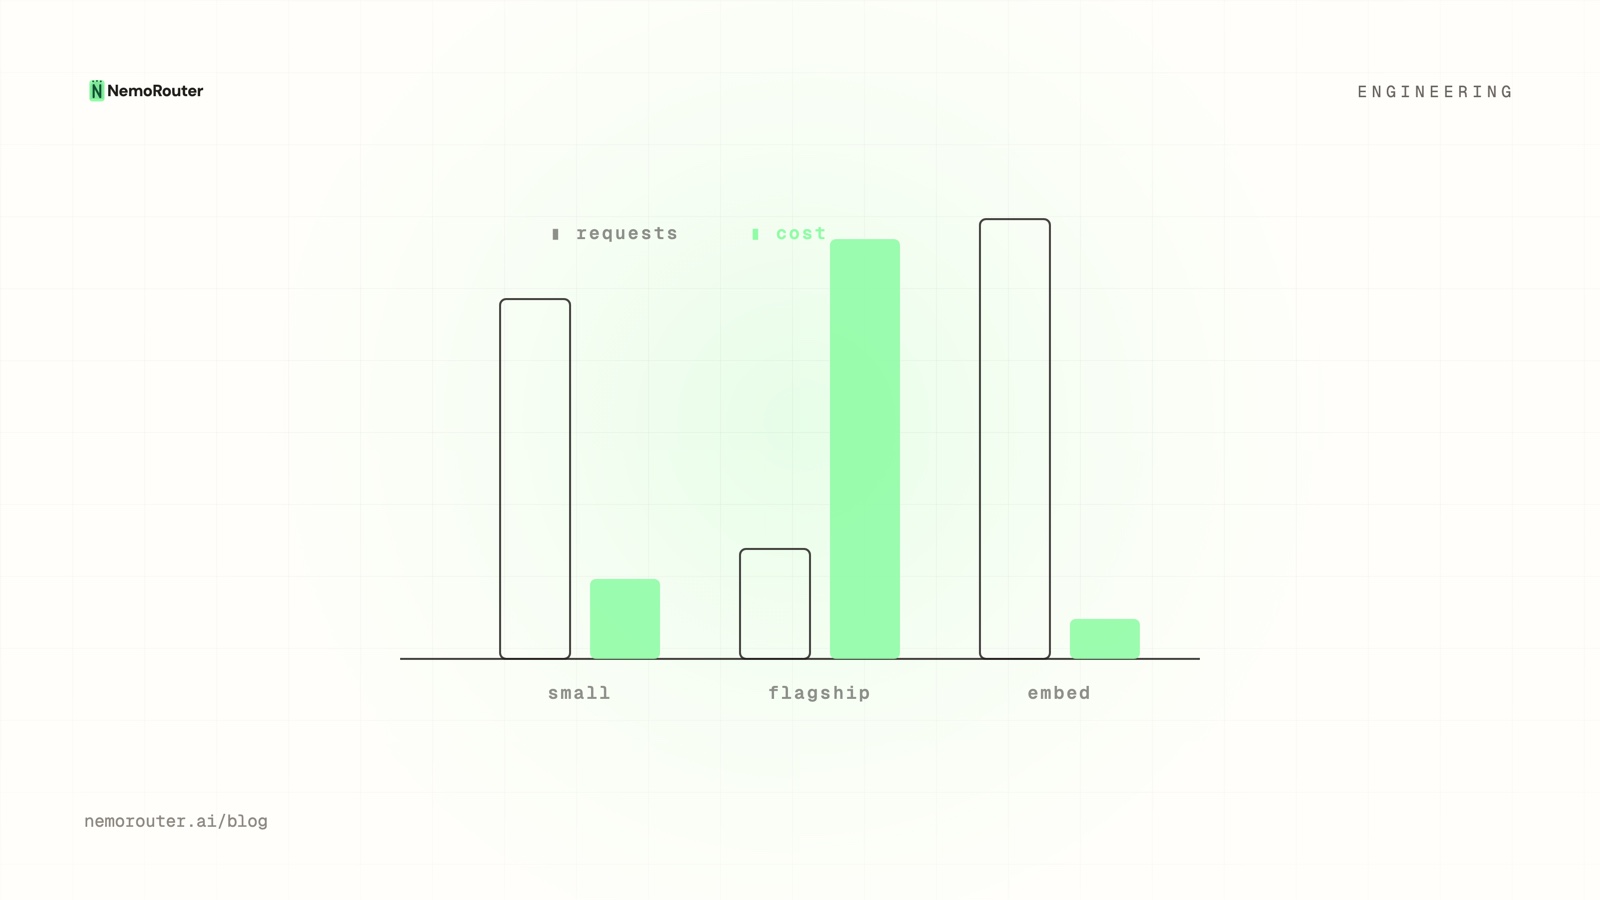
Don't average across models
A single p95 over all traffic blends a fast small model with a slow flagship and tells you nothing actionable. Percentile per model (and per route), then compare. The fix for a bad p99 is usually specific to one model or one prompt shape — you can't see it in the blended number.
Reading tail latency on the gateway
Because the gateway sits in the path of every request, it's the natural place to measure latency consistently — same clock, same definition, across every provider. NemoRouter's Performance view reports p50/p95/p99 and throughput, and crucially counts every request in the denominator (not just a sample), so the percentiles reflect reality rather than a lucky subset.
When you spot a bad tail, the usual suspects, in order:
- Oversized prompts — long contexts inflate both TTFT and total. Check whether the p99 requests are the big-context ones.
- Fallbacks firing — a primary provider erroring and a fallback kicking in adds a round trip. A p99 spike that correlates with a provider's incident is this.
- Retries — client or gateway retries stack latency. A request that retried twice is three requests' worth of wall-clock.
- Cold starts — the first request to a sparsely-used model/route.
The takeaway
Latency is a distribution, not a number. Track p50 for the typical experience, p95 for your SLOs, and p99 for the worst cases that decide trust — per model, with TTFT and total measured separately. Watch the p50-to-p99 gap: when it widens, something is occasionally going badly wrong, and the gateway's per-request percentiles are where you'll see it first. Open the Performance view to read yours.